
(AI translated)
For several years now, Olympus has not been able to make decent software. Even the most elementary errors are still not fixed, and don’t even ask about the graphs. In my work, I sometimes need to compare the entire XRF spectrum—like comparing the “fingerprint” of a material. Not just compare but also highlight important zones, add markers, and, of course, print it nicely or export it to a PDF file. All the software was written in about five evenings and purely “for fun.” In the process, I learned a bit more about .NET capabilities.
To use the program, you need to somehow export the XRF spectrum to a CSV file. That doesn’t work immediately either, but you can overcome Olympus’s foolishness and somehow extract the data. Then you need to remove the first 40 rows and the first column (maybe I’ll make automatic import later).
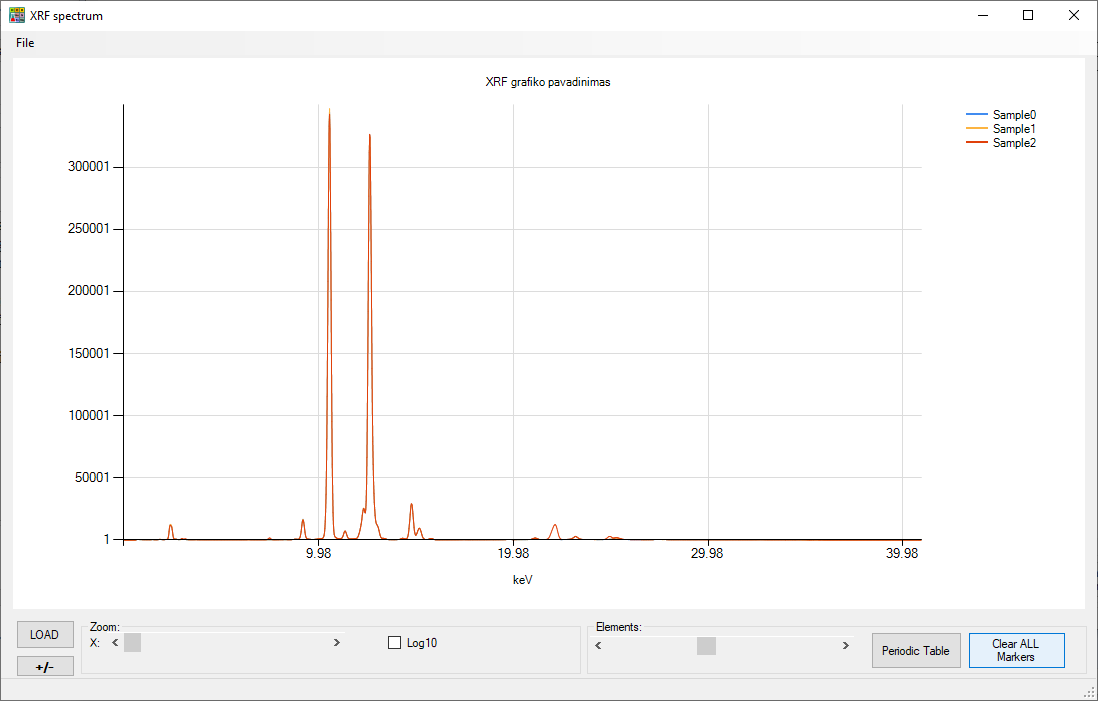
A working example with three materials that are very similar. The “standard” graph seen in the original software looks something like this:
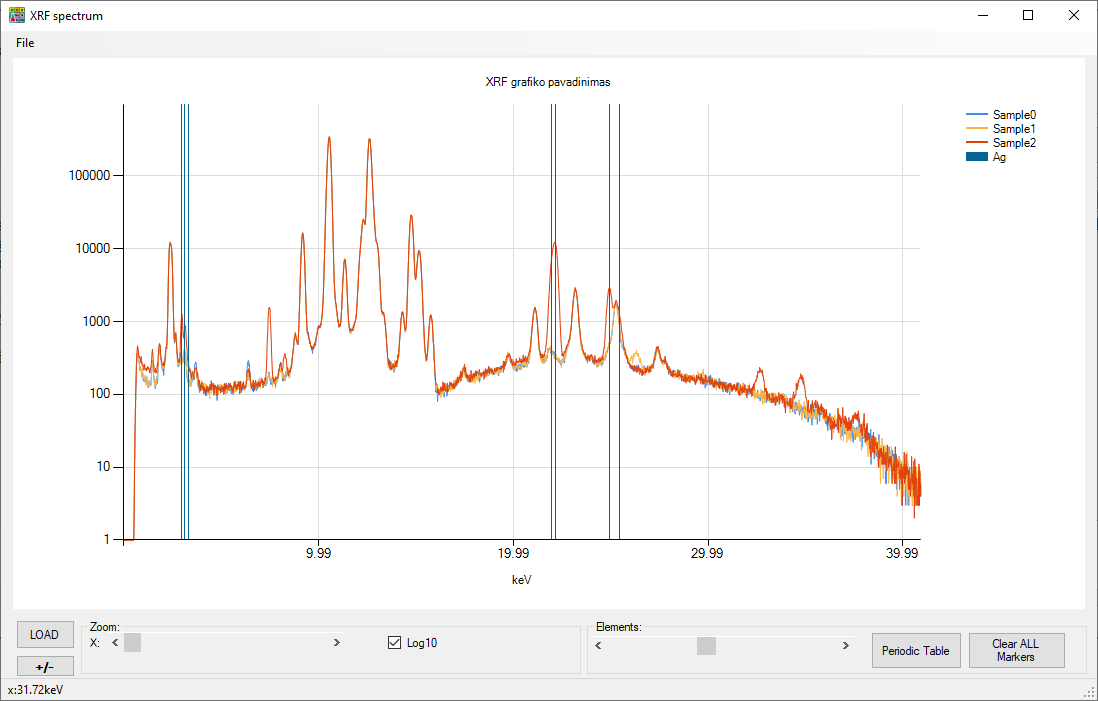
In the old version of the original software, which only runs on XP, there was a logarithmic scale. So we made a logarithmic scale:
You can see an anomaly at the silver. Knowing that these materials are declared as identical, it is clear that someone is slightly cheating. One material is very poor catalysts, the other material is the same catalysts but with burnt capacitors or some other catalysts added. Probably nothing malicious, but “non-standard” materials sometimes affect quantitative XRF analysis (compared to ICP) and all kinds of “bad things” start, like poor measurements or similar complaints. And when you “magically,” like Sherlock Holmes, say—dear sir, did you perhaps pour some “condensers” into the general barrel? Everything gets sorted out immediately.
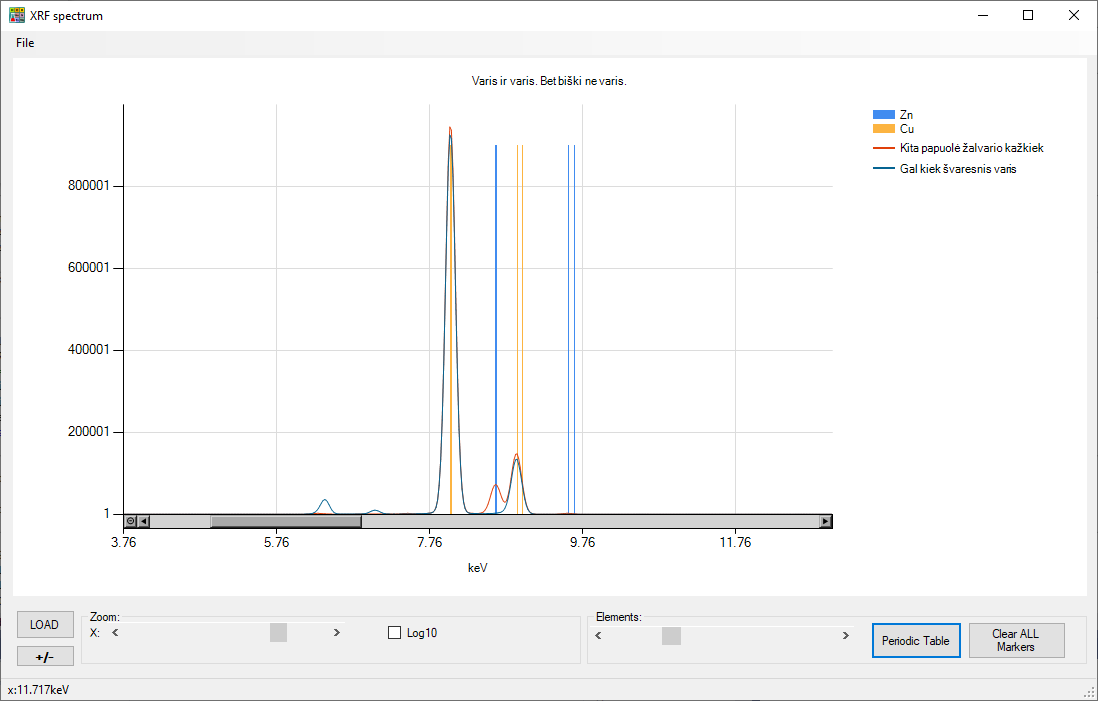
Two materials—one is copper, the other is also copper. But apparently, a little bit of zinc got in from somewhere. And this is what the PDF file with the same report looks like: copper-non-copper.
And here is an illustration explaining why sometimes XRF shows nonsense:
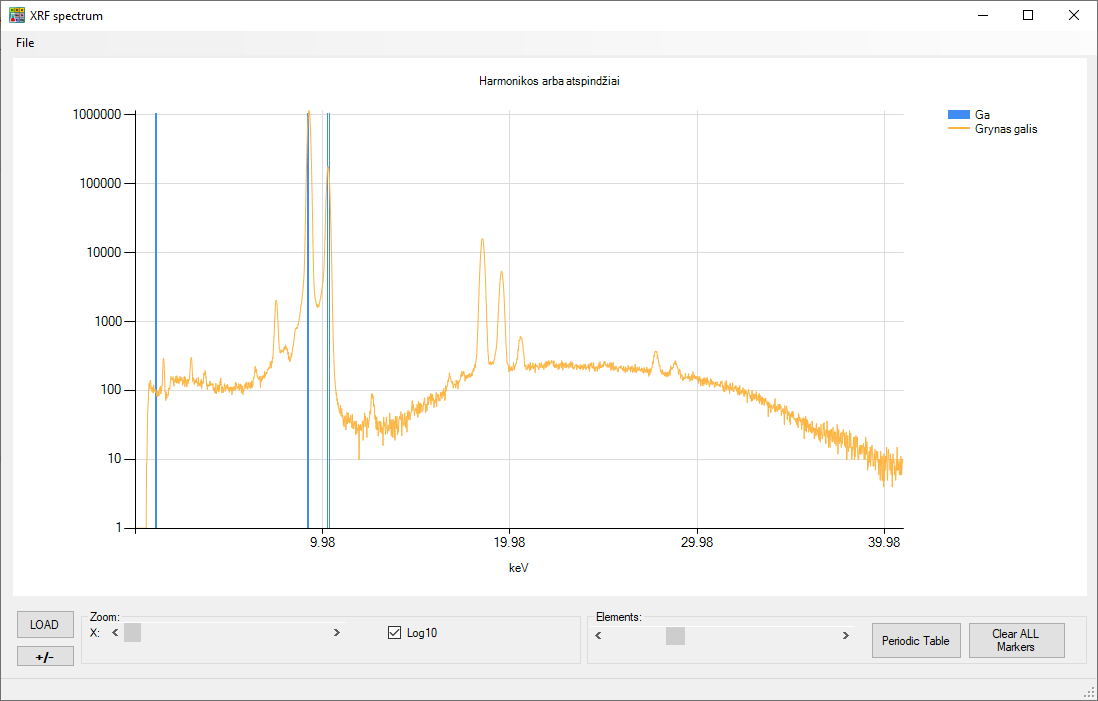
This is pure, 100% gallium measured. Its XRF spectrum is marked with a marker. And what are these recurring nonsense on the right? A new unknown element. Nobel Prize! Unfortunately, these are just harmonics when analyzing a strong signal. And now let’s think about how complex the software that does quantitative analysis must be: it has to consider harmonics, the fact that some elements cover others, that the X-ray tube itself is made of some metals, that there is also “scatter” radiation, when X-rays of any level reflect and fool the detector, that some elements absorb X-rays, while some materials let primary rays penetrate deeper and then fully lock any reflections inside, but when a weaker radiation is released, everything works.
This was a bit about my current job, not really related to electronics, right? 🙂
The program itself and some demo CSV files (already prepared for work): XRF.